

For the end-to-end flow, see the invalidation lifecycle diagram in
Architecture Overview.
How invalidations are organized
An invalidation event identifies the assertion and contract involved in a violation. An event can contain one or more invalidating transactions, allowing related attempts to be reviewed together while preserving transaction-level evidence. The platform separates invalidations by environment:- Production: violations detected on enforced assertion paths
- Staging: observe-only violations recorded while an assertion is being evaluated before production promotion
Project Invalidations (Manager View)
Detailed project invalidations are visible only to the project manager and approved collaborators inside the project dashboard.
Invalidation list
Open a project and select Invalidations. The page shows the current assertion status, recent invalidation activity, and separate Production and Staging tabs. Each invalidation row includes:- Date occurred
- Invalidation ID
- Assertion affected
- Contract affected
- Network
- Environment
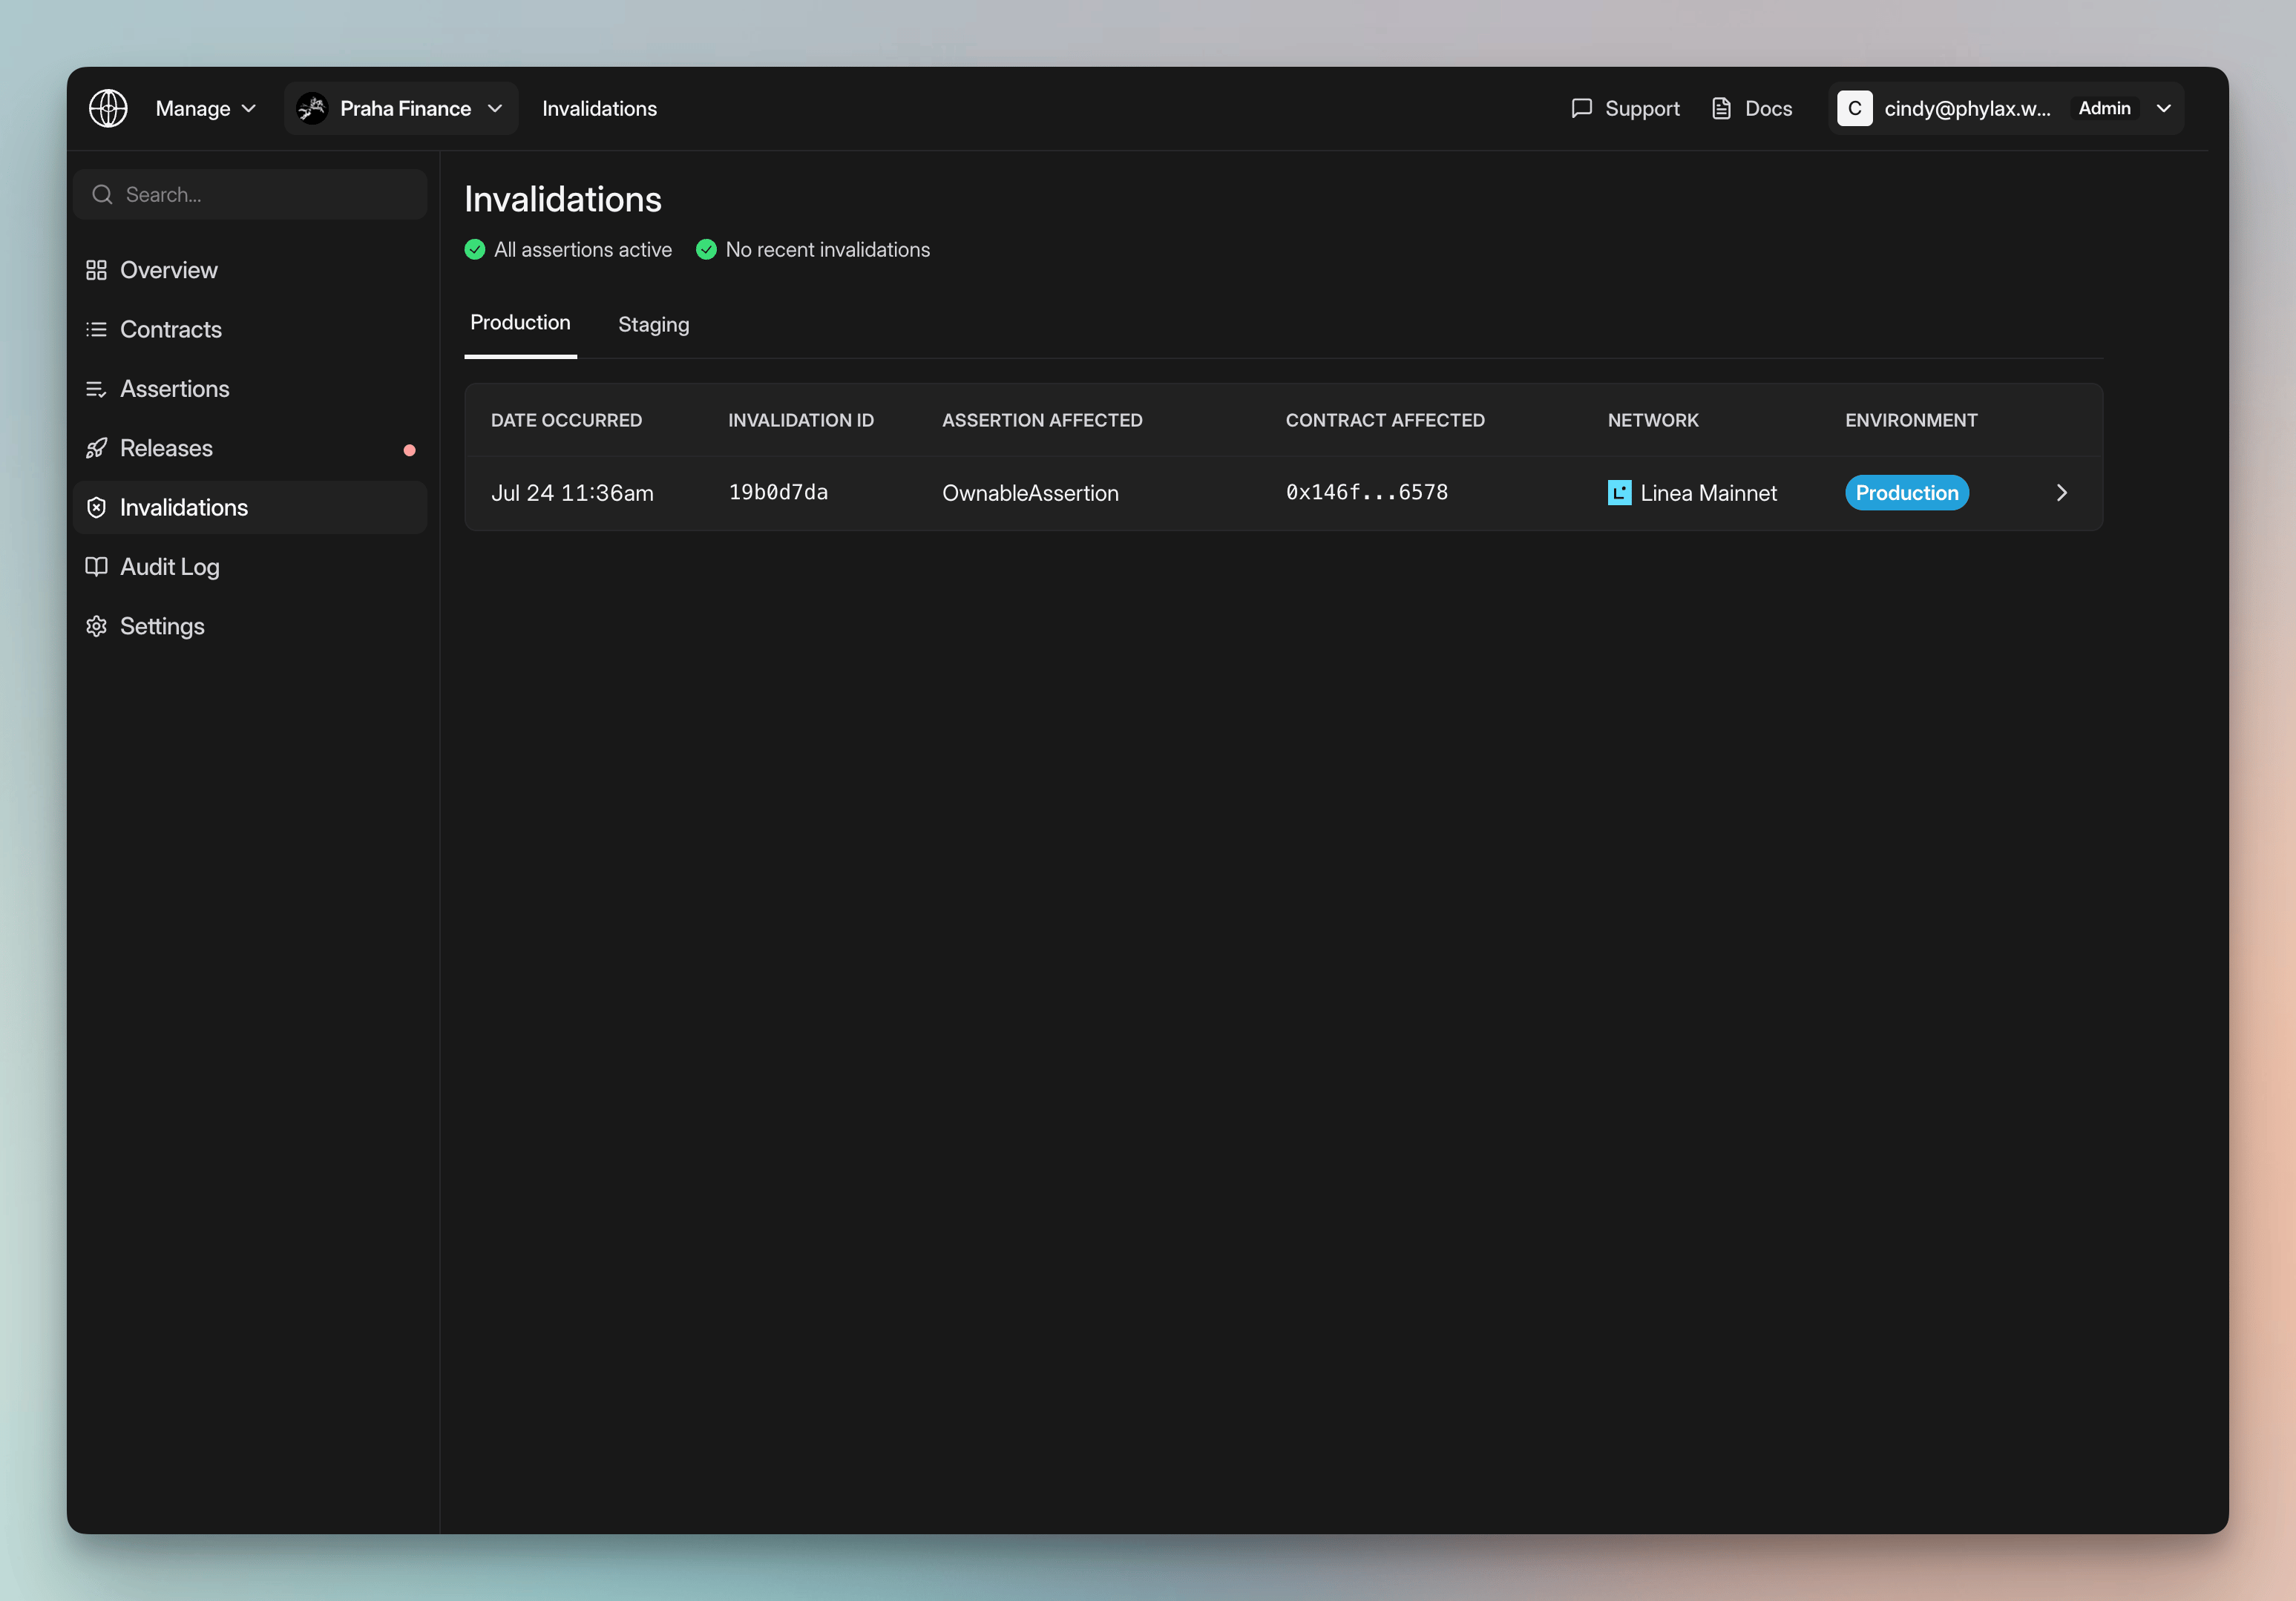
Project invalidations organized by production and staging environment
Invalidation event
The invalidation event page summarizes the event and lists its invalidating transactions. Event details include:- Date occurred
- Invalidation ID
- Public Ref ID, when available
- Assertion affected
- Contract affected
- Environment
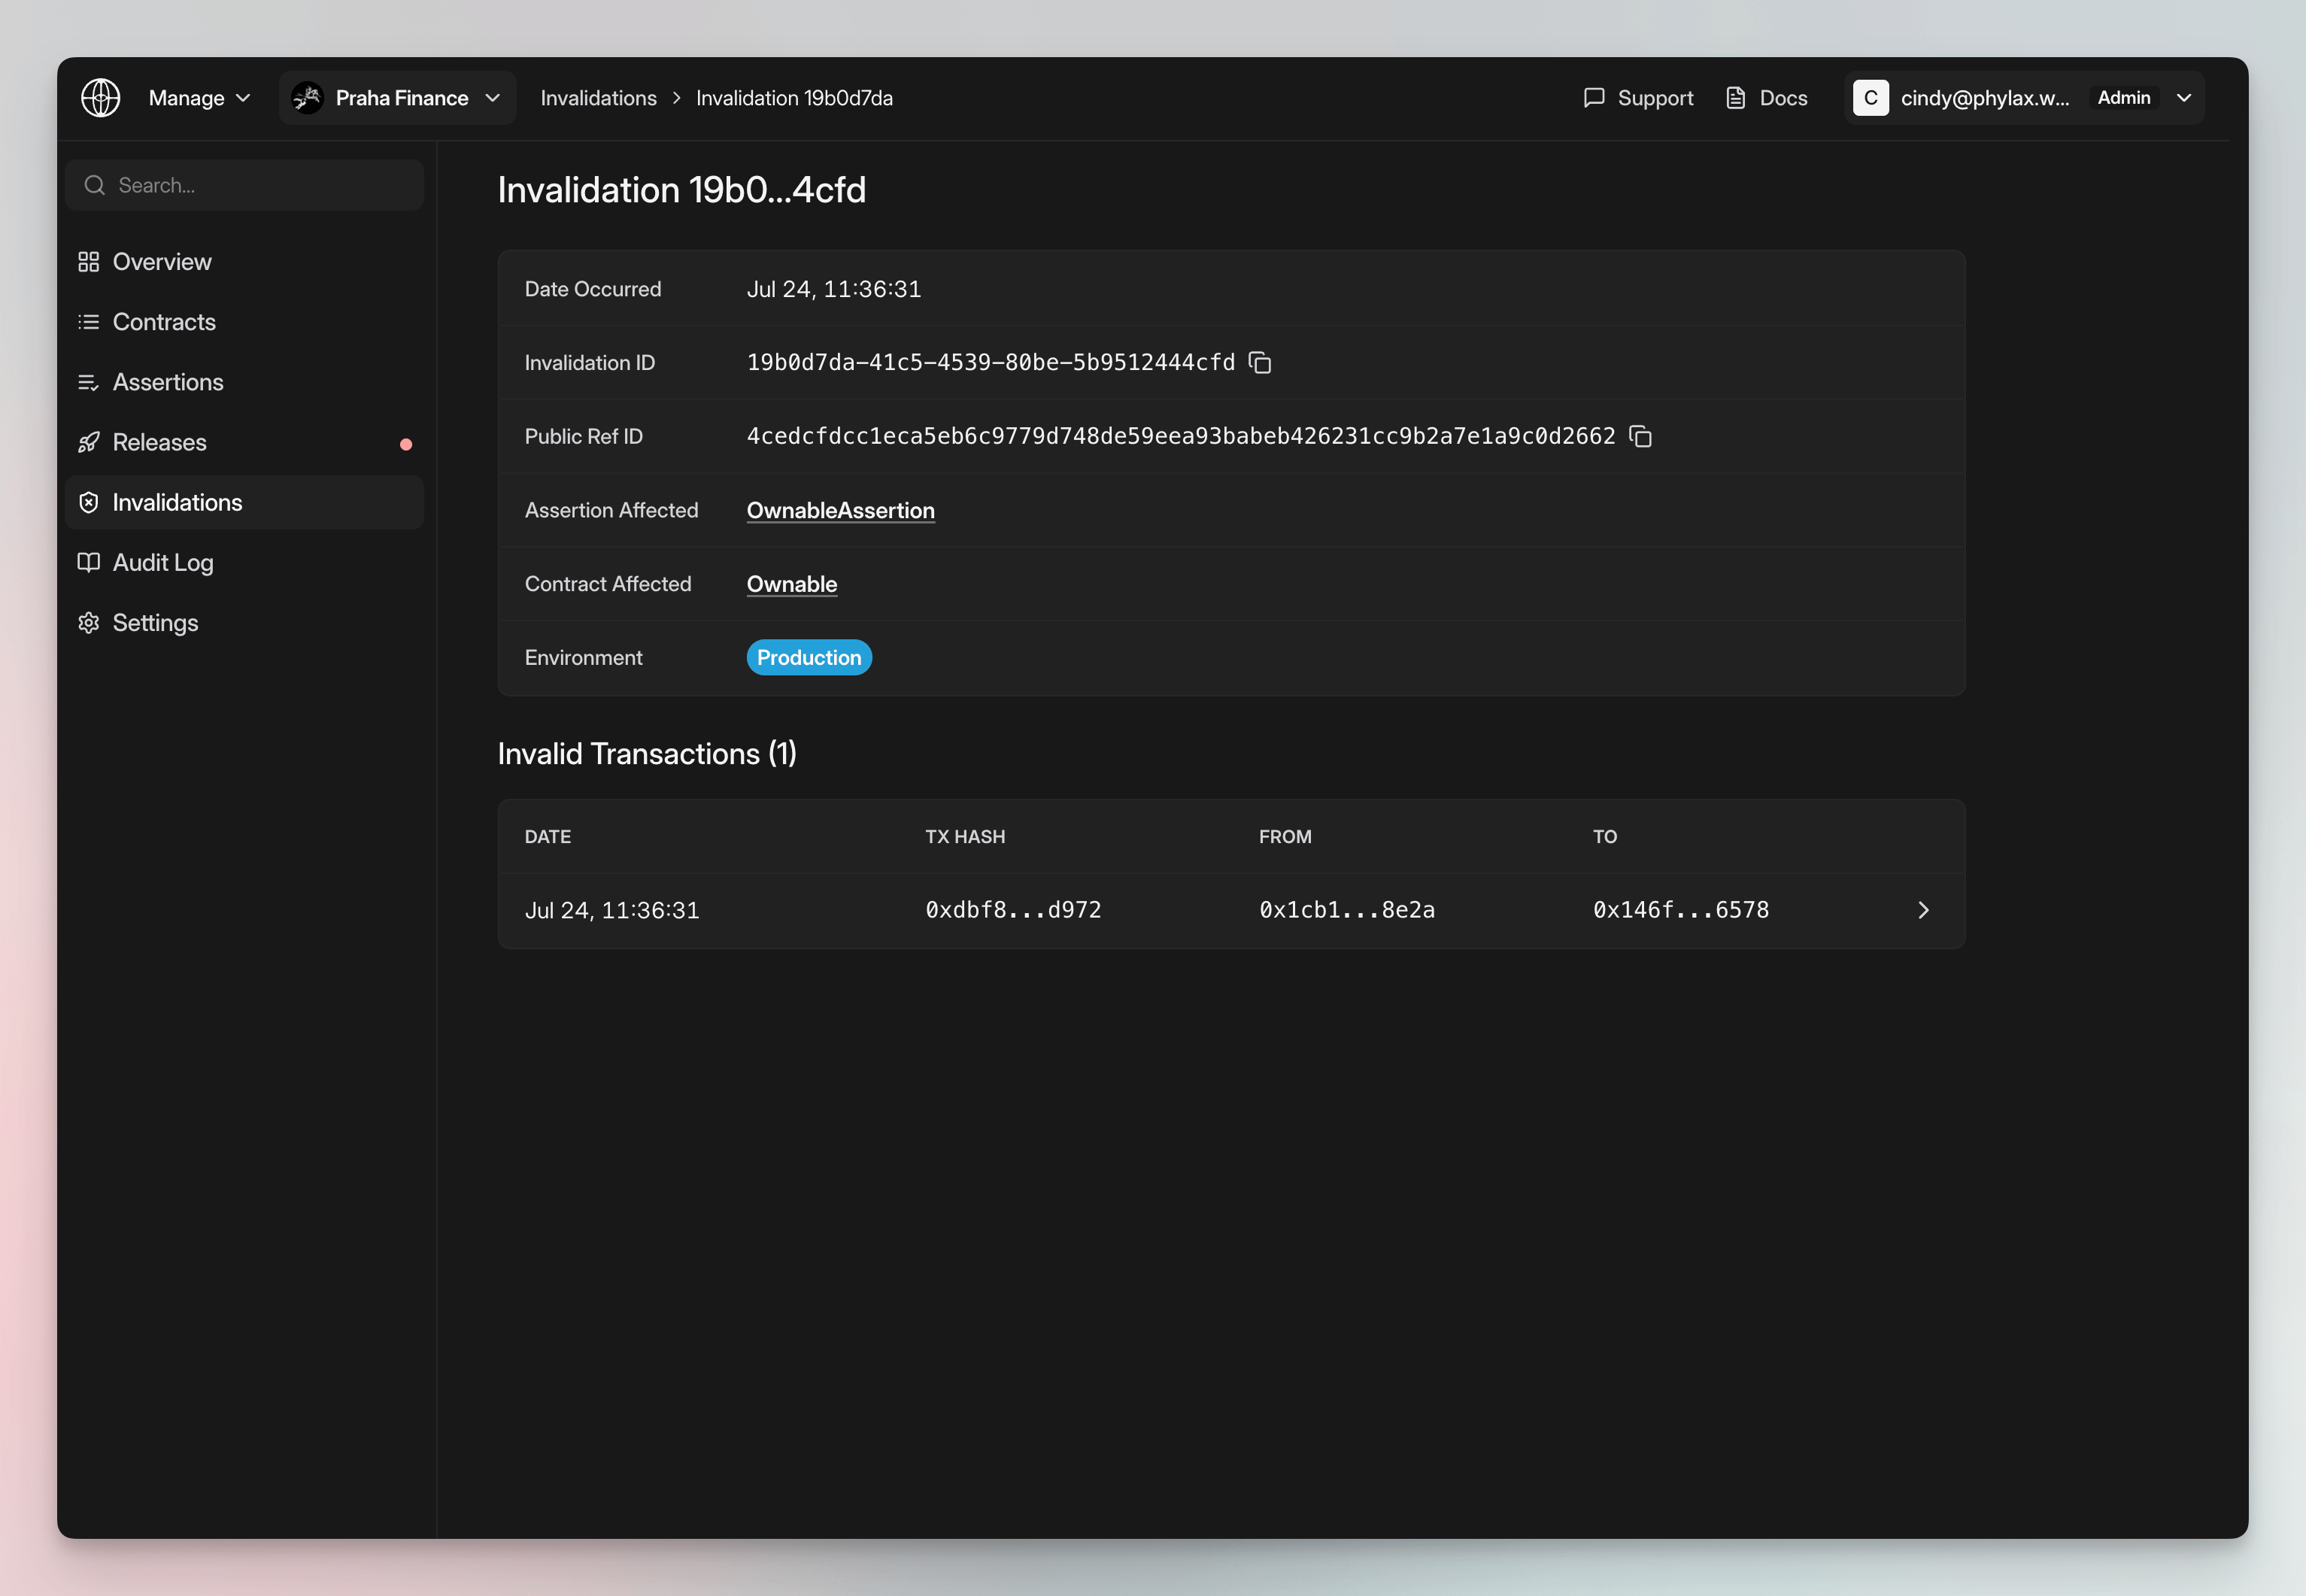
Invalidation event with event metadata and invalidating transactions
Invalidating transaction replay
The transaction replay explains what the transaction attempted, how the protocol call executed, and why the assertion rejected it. The replay includes:- Replay overview: transaction status, hash, sender, recipient, transaction type, nonce, gas, and network
- Assertion result: assertion name, selector, adopter, and revert reason
- What changed: confirmed token, vault, Safe, and administrative events shown in execution order
- Execution evidence: separate views of transaction execution and assertion evaluation
- Developer data: raw transaction and assertion traces, including hidden internal calls when expanded
- Execution context: block state, prior transactions, and block environment used for the replay
- Transaction execution: Did the protocol call run successfully?
- Assertion evaluation: Did the resulting state satisfy the assertion?
Review an invalidating transaction, classified changes, execution evidence, and developer data
Real-time updates and alerts
Project teams can configure external notifications:- Slack: receive invalidation notifications through a Slack integration
- PagerDuty: send invalidation notifications to an incident-response workflow
Invalidations in The Phylax Explorer
The Phylax Explorer can show redacted aggregate invalidation history, such as a reference ID and timestamp, when that data is public. Full transaction payloads, replay evidence, traces, staging records, notification settings, and project-specific evidence remain available only to project managers and approved collaborators.Staging vs. production
Use cases
- Monitor assertion violations across production and staging
- Review the state change and assertion result for an invalidating transaction
- Inspect transaction execution, assertion evaluation, traces, and replay context
- Tune assertions using staging evidence before production promotion
Next steps
Platform Overview
Learn more about the platform
The Phylax Explorer
Browse projects and assertions
Writing Assertions
Learn how to write effective assertions
Architecture
Understand how assertion validation works